Crypto & Web3·Aug 3, 2026

U.S. Jobs, Circle, Galaxy, American Bitcoin earnings: Crypto Week Ahead

Your look at what's coming in the week starting Aug. 3

CoinDesk4 min readVerified

U.S. Jobs, Circle, Galaxy, American Bitcoin earnings: Crypto Week Ahead
Image · CoinDesk
The gist
5-point summary · 1 min

Your look at what's coming in the week starting Aug. 3

  • 6: MARA Holdings (MARA), post-market, -$0.33Token EventsGovernance Votes & CallsStake DAO is voting to extend its SDGP-70 ex gratia compensation to Arbitrum asdCRV LlamaLend borrowers who were unfairly liquidated during the May 27 vsdCRV oracle manipulation.
  • 3.1inch DAO is voting to adopt the SEAL Safe Harbor Agreement, offering whitehat hackers legal protection and a bounty of up to $500,000 to rescue protocol funds during active exploits.
  • 3.Giveth DAO is voting to allocate 8.5M GIV to extend its GIVpower staking rewards on Optimism and Gnosis Chain until February 2027.
  • 3: SUI$0.6851 to unlock 0.6% of its circulating supply worth $17.2 million.Aug.
  • 7: Layer One X (L1X) to unlock 7.4% of its circulating supply worth $146.9 million.Aug.
$62,560.27$63,000,$0$8$500,000$41.3 million
In this article

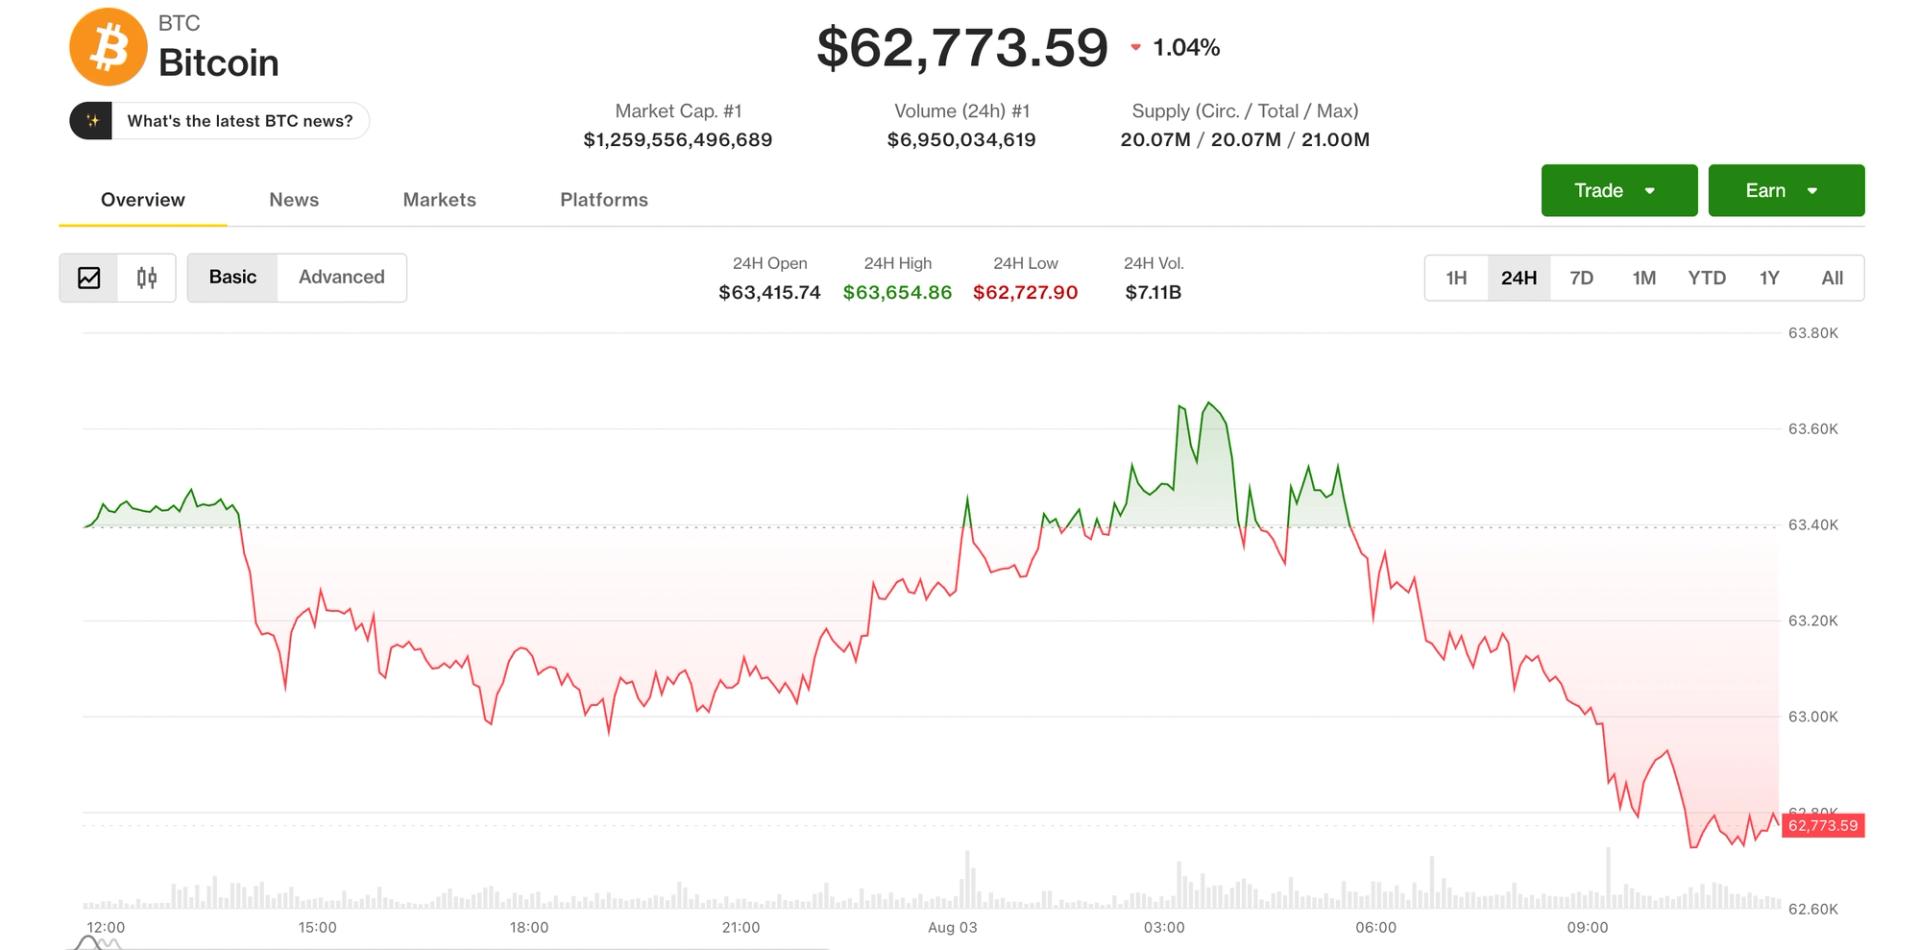
Aug 3, 2026, 8:16 a.m. 3 min readEarnings reports feature in the coming week. (ds_30/Pixabay)SummaryCrypto Week Ahead is a comprehensive list of what's coming up in the world of cryptocurrencies and blockchain, as well as the major macroeconomic events that will influence digital asset markets.Bitcoin BTC$62,560.27 started the week just below $63,000, with Friday’s U.S. jobs report the biggest macro event likely to determine whether the July rebound continues, though developments in Iran may take on greater significance in the coming days.A muted rise in U.S. hiring could be the best outcome for risk assets like crypto. Such a rise would ease fears of an economic slowdown, but wouldn’t push the Federal Reserve closer to raising interest rates.IG market analyst Tony Sycamore said a gain of around 88,000 jobs with unemployment unchanged at 4.2% would strike that balance in a “Goldlocks-type print.”The U.S. government’s borrowing plans are another macro focus. JPMorgan strategist Jay Barry said the Treasury is likely to keep its regular debt sales unchanged, which would avoid adding pressure to interest rates. Larger-than-expected sales could raise borrowing costs for households and companies and weigh on crypto.Traders will also watch earnings from Circle, Galaxy, Block and six bitcoin miners. BIP-110, a proposal to temporarily limit non-financial data stored on the Bitcoin blockchain, is expected to enter its required miner-signaling period.With less than 3% support, it is more likely to move nodes enforcing the change onto a small alternative chain than alter Bitcoin’s main network.What to Watch(All times ET)CryptoAug. 3: Ctrl Wallet to disable sending, receiving, swaps and decentralized app (dapp) access as it begins an export-only winddown.Around Aug. 7: BIP-110’s mandatory miner-signaling window to begin at block 961,632.MacroAug. 3, 10 a.m.: U.S. ISM Manufacturing PMI for July (Prev. 53.3)Aug. 4, 10 a.m.: U.S. JOLTs Job Openings for June (Prev. 7.594M)Aug. 5, 8:15 a.m.: U.S. ADP Employment Change for July (Prev. 98K)Aug. 5, 8:30 a.m.: U.S. Treasury Quarterly Refunding AnnouncementAug. 5, 10 a.m.: U.S. ISM Services PMI for July (Prev. 54)Aug. 6, 5 a.m.: Eurozone Retail Sales YoY for June (Prev. 1.6%)Aug. 6, 8:30 a.m.: U.S. Initial Jobless Claims for period ending Aug. 1 (Prev. 197K)Aug. 7, 8:30 a.m.: U.S. Nonfarm Payrolls for July (Prev. 57K); Unemployment Rate (Prev. 4.2%); Average Hourly Earnings MoM (Prev. 0.3%)Aug. 8, 9:30 p.m.: China Consumer Price Index YoY for July (Prev. 1.0%); MoM (Prev. -0.3%)EarningsAug. 3: American Bitcoin (ABTC), pre-market, $0.15Aug. 4: Hut 8 (HUT), pre-market, -$0.32Aug. 5: MercadoLibre (MELI), post-market, $8.95Aug. 5: Circle Internet Group (CRCL), pre-market, $0.17Aug. 5: Galaxy Digital (GLXY), pre-market, -$0.05Aug. 5: Riot Platforms (RIOT), pre-market, -$0.22Aug. 5: Block (XYZ), post-market, $0.79Aug. 5: TeraWulf (WULF), pre-market, -$0.19Aug. 6: CleanSpark (CLSK), post-market; -$0.26Aug. 6: MARA Holdings (MARA), post-market, -$0.33Token EventsGovernance Votes & CallsStake DAO is voting to extend its SDGP-70 ex gratia compensation to Arbitrum asdCRV LlamaLend borrowers who were unfairly liquidated during the May 27 vsdCRV oracle manipulation. Voting ends Aug. 3.1inch DAO is voting to adopt the SEAL Safe Harbor Agreement, offering whitehat hackers legal protection and a bounty of up to $500,000 to rescue protocol funds during active exploits. Voting ends Aug. 3.Giveth DAO is voting to allocate 8.5M GIV to extend its GIVpower staking rewards on Optimism and Gnosis Chain until February 2027. Voting ends Aug. 3.QuickSwap is voting whether to leave its Old QUICK to New QUICK converter open indefinitely or close it via a six-month phase-out schedule. Voting ends Aug. 4.GoodDollar DAO is voting to establish its first Treasury Committee to oversee budget planning and member recruitment. Voting ends Aug. 5.Orbs is voting to formally establish the Orbs DAO, create its initial multisig wallets, and delegate foundational powers to the new organization. Voting ends Aug. 6.UnlocksAug. 3: Bittensor (TAO) to unlock 2.3% of its circulating supply worth $41.3 million.Aug. 3: SUI$0.6851 to unlock 0.6% of its circulating supply worth $17.2 million.Aug. 5: Succinct (PROVE) to unlock 116.7% of its circulating supply worth $39.3 million.Aug. 7: Layer One X (L1X) to unlock 7.4% of its circulating supply worth $146.9 million.Aug. 7: JTO$0.4992 to unlock 3.9% of its circulating supply worth $8.5 million.Aug. 8: Stable (STABLE) to unlock 3.7% of its circulating supply worth $30.3 million.Token LaunchesAug. 3: Kayan to start the KYN token-generation event and listing on the Panoptes PBC ATS marketplace.Aug. 7: Coinbase Prime to delist IDEX$0.001037, Loopring (LRC), Omni Network (OMNI), Pirate Nation (PIRATE) and FIS$0.003800.Related Assets12345678910The Evolution of the Crypto CEX Landscape: A Case Study on BinanceThe Evolution of the Crypto CEX Landscape: A Case Study on BinanceBinance remains crypto’s leading exchange, expanding from spot and derivatives into RWAs, payments, savings, yield, and broader financial services.Jun 29, 2026Binance remains crypto’s leading exchange, expanding from spot and derivatives into RWAs, payments, savings, yield, and broader financial services.Why it matters:Binance remains crypto’s leading exchange, expanding from spot and derivatives into RWAs, payments, savings, yield, and broader financial services.View Full Report

Integrity note  ·  Xela does not rewrite or paraphrase article content. The excerpt above is the source publication's own words, sanitized for display. For the full piece — including any quotes, charts, or images — read it at CoinDesk. Xela's rewritten version is off for this story, so there's no editorial angle attached — you're getting the source's reporting unfiltered. When the rewrite is on, we add a What this means block underneath with the operator/trader takeaway.

What people are saying

Discussion

Hot takes

0/280

Loading takes…

Comments

Discussion · 0

Sign in to comment, like, and save articles.

Sign in

Loading comments…

Keep readingCrypto & Web3 desk
See all in Crypto
Ethereum analysis at the start of this week: Bears are a little stronger but this trading map is the key for crypto traders
·

Ethereum analysis at the start of this week: Bears are a little stronger but this trading map is the key for crypto traders

Ethereum price analysis today: ETH bears press $1,852, but support has not broken yet Ethereum futures outlook score: -4 / +10 Bias: Moderately bearish while below $1,881.50, but sellers still need confirmed acceptance beneath $1,848.50 to activate the next downside leg. Ethereum futures are trading near $1,860.50 after retreating from Sunday’s high at $1,903.50. Short-term market structure remains bearish, with failed rebounds, declining resistance and accepted value moving closer to the bottom of the recent range. However, Ethereum is now pressing a heavily defended support cluster between approximately $1,848.50 and $1,857.50. This makes the outlook more balanced than the bearish score alone may suggest. The market is weak, but it is also compressed against support. That combination can produce either a confirmed breakdown or a sharp rebound if sellers fail to extend the decline. Key takeaway: Ethereum remains bearish below $1,881.50, but selling directly into $1,852 carries poor location unless price confirms that support has failed. Bulls need to repair the structure above resistance, while bears need sustained acceptance below $1,848.50. Why the Ethereum outlook remains bearish After my previous analysis whereby as active traders evaluate whether buyers can reclaim structural order flow, I am looking at geopolitics which continues to drive macro sentiment: headline risks remain elevated after , which spilled directly into Asian trading sessions where . Looking ahead to today's trading calendar, keeping a close eye on will be critical for managing exposure across both traditional asset classes and digital assets. Back to crypto, Ethereum futures initially balanced between approximately $1,905 and $1,935 before attempting to establish higher value near $1,930-$1,943. That attempt failed. Several developments reinforce the bearish interpretation: On July 30, Ethereum futures reached $1,946 but closed near $1,921, even though buying activity was strongly positive. Buyers were aggressive, but they could not establish higher prices. Ethereum subsequently fell through the psychologically important $1,900 area and continued toward $1,852. Friday’s rebound from approximately $1,849-$1,852 reached $1,881.50, but buyers could not sustain the repair. Sunday’s reopening rally reached $1,903.50, briefly moving above the previous value-area high near $1,889, before being rejected. The current session’s accepted trading activity has migrated lower. The last point is especially important. The previous session’s value-area high was near $1,889, while the current value-area high is developing near $1,878.50. The point of control, where the most volume traded, has shifted from approximately $1,872 toward $1,860.50. This means the market is not merely dipping briefly. Traders are increasingly conducting business at lower prices. Why chasing Ethereum lower may still be dangerous The bearish evidence is meaningful, but Ethereum has not yet established accepted value below $1,852. That area has repeatedly attracted support, and several technical references are concentrated nearby: Developing activity around $1,857.50-$1,860.50 Developing and previous value-area support near $1,852-$1,854.50 The July 31 structural low near $1,849 Higher-timeframe support around $1,848.50 The psychological $1,850 level The latest completed hourly sequence also showed shrinking volume and narrower price ranges after the test of $1,852. One of the heavier selling bars reached $1,852 but recovered to close at $1,858.50. The following bars did not immediately produce a fresh low. That can indicate that sellers are beginning to lose momentum or that passive buyers are absorbing market sell orders. It does not prove that a lasting bottom has formed, but it warns against assuming that every move beneath $1,860 will automatically continue lower. Repeated tests of support can have two very different outcomes. They can weaken the level until it breaks, or they can exhaust sellers and produce a reversal. Price still needs to reveal which outcome is developing. The higher-timeframe Ethereum structure The daily chart provides an important counterweight to the short-term bearish evidence. Ethereum broke out of a broader bull-flag structure in mid-July and subsequently retested the breakout area. The current decline may still be a correction or consolidation within that larger recovery rather than the beginning of a complete structural breakdown. Daily support near $1,848.50-$1,850 is therefore highly relevant. It aligns with several earlier highs, lows and opening-price references. If this area holds, Ethereum could be completing another downward leg inside its broader July range. If it fails, the immediate intraday downside targets may be followed by a deeper higher-timeframe test near $1,788-$1,780. That region includes the previous monthly value-area low and the approximate location of the earlier bull-flag breakout. A still deeper extension could eventually bring approximately $1,766 into view, although that is not the immediate TradeCompass scenario. Ethereum bullish above $1,881.50 The bullish TradeCompass threshold is $1,881.50. The current value-area high is developing near $1,878.50, but a brief move above that price may only represent a liquidity probe. The published bullish threshold includes a buffer above the resistance cluster. Acceptance above $1,881.50 would indicate that buyers are beginning to reverse the downward migration of value and repair the latest breakdown. Bullish partial-profit targets are: $1,888, just before the previous value-area high near $1,889 $1,898-$1,900, ahead of Sunday’s high and the $1,900 round number $1,909-$1,911, around previous balance and resistance $1,919.50, just before the earlier $1,920.50 reference The bullish outlook would improve further if Ethereum sustains trade above $1,900-$1,903.50, rather than merely touching that area. Beyond the immediate TradeCompass targets, a stronger recovery through approximately $1,933-$1,935 would reopen the path toward: The previous monthly value-area high near $1,968 The July 27 high at $1,981.50 The psychologically important $2,000 level This larger bullish path remains possible, but Ethereum must first repair the local structure above $1,881.50. Ethereum bearish below $1,848.50 The bearish TradeCompass threshold is $1,848.50. A small move beneath $1,852 would not necessarily be sufficient. It could become a liquidity sweep below an obvious support level, followed by a fast recovery. The cleaner bearish confirmation would involve: Sustained trade beneath $1,848.50 Failure to reclaim $1,849-$1,852 New high-volume activity developing beneath the broken support shelf Continued migration of accepted value to lower prices If the bearish scenario activates, downside areas to consider for partial profit-taking are: $1,844.50-$1,840 $1,837.50-$1,833 $1,822-$1,820, if selling accelerates A rapid recovery back above $1,852 after a breakdown would warn that the move may have been a failed breakdown rather than genuine bearish acceptance. The Ethereum decision zone While price remains between the two activation thresholds, Ethereum is inside a broad decision zone: Above $1,881.50: Bullish repair activates $1,872-$1,881.50: Main resistance and decision area $1,860.50-$1,872: Internal repair zone $1,852-$1,857.50: Concentrated support Below $1,848.50: Bearish continuation activates Inside this range, both sides remain vulnerable to false starts. Holding $1,852 does not automatically make Ethereum bullish. It initially means only that sellers have failed to extend the decline. Likewise, briefly trading beneath $1,852 does not automatically validate a short. Sellers must clear the full support cluster and establish trade beneath it. What volume delta reveals, and what it does not Volume delta compares aggressive buying with aggressive selling. Positive delta means more contracts traded at the offer, normally associated with buyers crossing the spread. Negative delta means more contracts traded at the bid, normally associated with aggressive selling. However, delta should not be interpreted in isolation. When Ethereum reached $1,946 with strongly positive delta but failed to hold the advance, it suggested that sellers were absorbing aggressive buyers. Similarly, Friday’s rebound produced strong buying activity but failed to establish a lasting recovery above $1,881.50. The latest order-flow readings remain seller-aligned, but price has not yet accepted below $1,852. This disagreement between bearish activity and defended price is precisely why confirmation matters. A personal note on scores and key price gateways Although an outlook or score may begin bullish or bearish, I place greater importance on how price later reacts at the key gateways in the trading map. These levels are not random prices. They reflect accepted value, concentrated volume, previous highs and lows, liquidity behavior, psychological prices and relationships across multiple timeframes. A bearish score should not become a permanent opinion. If Ethereum reclaims an important gateway and holds above it, the evidence can shift from bearish toward neutral or bullish. If support breaks and fails on a retest, the bearish case becomes stronger. The map helps traders update their decision support as price supplies new information. This is consistent with the investingLive : trade the map rather than becoming attached to the initial prediction. A gateway can activate through a sustained hold, a candle close beyond the level or a breakout followed by a successful retest. A single tick above or below a threshold may not provide sufficient confirmation. How traders can approach the current Ethereum map The cleaner approach may be patience. Bulls can wait for acceptance above $1,881.50. Bears can wait for sustained trade below $1,848.50, ideally followed by a failed reclaim. A tactical countertrend long may become more attractive if Ethereum sweeps beneath $1,852 or $1,849, quickly recovers and then reclaims $1,860.50. A rebound that fails between $1,860.50 and $1,872 may provide bears with better location than selling directly into support. If a scenario activates and reaches its first target, traders can consider taking a partial profit and reducing risk. After the second target, protecting the remaining position becomes increasingly important. A smaller runner can then pursue a larger move without allowing the full original risk to remain open. The suggested TradeCompass discipline is a maximum of one completed trade per direction for each published map. This helps reduce repeated entries, overtrading and emotionally driven attempts after a failed setup. Ethereum outlook conclusion Ethereum futures remain under bearish pressure, but the market has reached a support area that sellers have not yet broken convincingly. The lower migration of accepted value, failed rallies and rejection from $1,903.50 support the -4 / +10 score. The repeated defense of $1,849-$1,852, signs of declining hourly selling momentum and the still-relevant higher-timeframe bull-flag structure prevent a more aggressively bearish conclusion. The map is therefore conditional: Above $1,881.50, Ethereum begins a bullish repair. Below $1,848.50, bearish continuation becomes more credible. Between those gateways, price remains compressed and vulnerable to two-sided rotation. The current session profile is still developing, so its value-area and volume references may shift as more trading occurs. All prices refer to Ethereum futures and may differ from spot ETH or CFD quotations. Futures are leveraged instruments. Position size, stops, slippage and contract selection should be considered before any trade. Trade at your own risk. This article was written by Itai Levitan at investinglive.com.

ForexliveSingle source
Newsletter

Track crypto & web3 every morning.

Daily digest tuned to this beat. The 5 stories most worth your time. Unsubscribe anytime.