
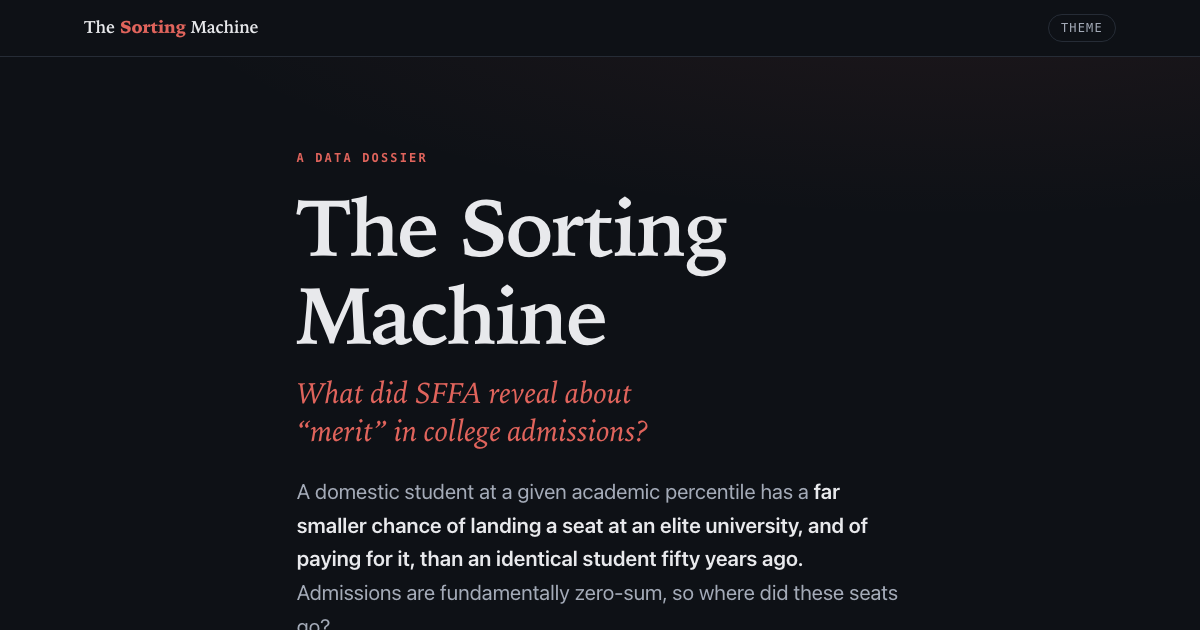
The Sorting Machine A data dossier What did SFFA reveal about “merit” in college admissions? A domestic student at a given academic percentile has a far smaller chance of landing a seat at an elite university, and of paying for it, than an identical student fifty years ago. Admissions are fundamentally zero-sum, so where did these seats go? One applicant enters at the top. The pegs are the factors: SAT, GPA, sports, legacy, donor, race. The machine sorts each drop into one of two bins, a wide REJECTED and a narrow ACCEPTED. Most land left. 01 · The squeeze Different doors, wildly different odds. Every applicant is sorted into a lane before the file is even read, and the gates on those lanes are not the same size. A recruited athlete walks through an opening five-sixths of the way open. The unhooked domestic applicant faces a pinhole. Same university, same year, a roughly 17-fold gap in the odds of getting through. Admit rate by track: the gate you're sorted into Applicants stream in from the left; each gate's opening is scaled to that track's admit rate. Watch where the crowd piles up. SOURCE · Admit rates from Arcidiacono, Kinsler & Ransom, Legacy and Athlete Preferences at Harvard (using Harvard's records in SFFA v. Harvard): recruited athletes 86%, faculty/staff children 47%, dean's-interest 42%, legacies 34%, vs. under 5.5% for non-ALDC applicants. NBER w26316 · full paper. Lane widths (applicant volume) illustrative. 02 · The race gap The same file, four different verdicts. The most-cited number from the Harvard trial comes from a counterfactual. The plaintiffs' economist modeled one applicant profile and swapped only the race field. The model's predicted probability of admission moved from 25% to 95%. Modeled admit probability for one identical applicant, by race A male, non-disadvantaged applicant at a fixed academic and extracurricular profile, with only the race field varied. SOURCE · P. Arcidiacono expert report, SFFA v. Harvard: a baseline applicant with a 25% chance as Asian American would have ~36% as white, ~77% as Hispanic, ~95% as African American. See also NBER w27068. Figures are the plaintiffs' model estimates, disputed by Harvard's experts. This is a modeled probability rather than a real admit rate, and Harvard's experts disputed the specification. But no party disputed the direction: at equal academic strength, the personal-rating and race adjustments did not fall evenly across groups. 03 · Price discrimination A different price for every family. The published cost of attendance is a fiction almost no one pays. The real price is computed per household from a federal-and-institutional aid formula. This is textbook first-degree price discrimination: the same product, the same seat, sold to each family at the maximum the formula thinks it can extract. Here is the machine that sets your number. 1 · Cost of attendance $97,985/yr Tuition Housing Fees The full sticker: tuition, housing, meals, fees, books, travel, personal. The number the formula starts from. − 2 · Aid, set by your SAI FAFSA + CSS Profile The FAFSA (and, at elite privates, the deeper CSS Profile) turns your family's income and assets into a Student Aid Index. Grant aid = cost of attendance − SAI. The SAI is your price floor. = 3 · Your price $0 – $98k Two students sit in the same lecture. One paid near nothing, the other near $98k. The seat is identical; only the family was re-priced. What each family actually pays at Princeton, by income Average net price after grant aid, 2023–24. The 9× jump at the $110k line, then the climb to the full ~$98k, is the cliff. SOURCE · Avg. net price by income (Princeton, 2023–24): 68% white). A derived index, not a single published figure; international excluded (no domestic base). The hook advantage and the merit disadvantage are the same coin. The more a group is admitted through legacy and athletics, the more of its overall footprint is already spent, so its unhooked applicants compete for a shrunken remainder of merit seats, and against the largest unhooked applicant pool. The group that looks most "privileged" by the hooks is the one whose merit pipeline is squeezed hardest. (This reads the trial data as schools managing each group's total toward a rough band, which is well-evidenced but a point critics contest.) 05 · The vanishing test Two quiet thumbs on the scale. Since 2020, two changes have narrowed the merit door further. Both were sold as fairness. Both systematically disadvantage the same person: the high-scoring, unhooked applicant who has nothing but a strong record to stand on. Test-optional: more applicants, the same seats Harvard undergraduate applications, in thousands. Test-optional began for the Class of 2025, and applications jumped ~50% while the class stayed the same size. SOURCE · Harvard applications: 40,248 (Class of 2024, last test-required cycle) → 61,220 (Class of 2026, record-low 3.19% admit rate) — Harvard Crimson. Share of Common App colleges requiring scores fell ~55% (2019–20) → ~5% (2024–25); >1,900 colleges now test-optional — FairTest. Why "optional" hurts the high scorer. A 1550 used to be a cheap, legible signal that vaulted an unknown applicant out of the pile. Make the test optional and that signal goes quiet: a top score no longer separates you, because the reader leans harder on essays, activities, and "context," the soft factors that reward the polished and the coached. A Dartmouth study found disadvantaged applicants scoring above 1400 were 3× more likely to be admitted when they submitted scores. The very students test-optional was meant to help are hurt when they hold a strong score back. NBER Digest, 2025. The big-fish penalty. Every file is read "in context" of its high school. Reasonable in theory, but it means a strong student at a strong school is measured against a wall of equally strong peers, while an identical record at a weaker school stands out. Percent-plans and holistic "context" reward being a big fish in a small pond, and quietly penalize the applicant who swam in a harder one. Same 1500 SAT, four different high schools Estimated admit odds for one identical applicant, varying only the competitiveness of the high school. SOURCE · Illustrative model of the school-context effect, following percent-plan and holistic-review research (Texas Top 10%, UC ELC). Directional, not a measured admit rate. Stack the two together and they point at one person. The applicant with the strongest raw record, a top score earned at a rigorous school, is exactly the one the test-optional shift de-emphasizes and the context lens penalizes. Precisely the student the word "merit" was supposed to name. 06 · The counterfactual The same student, three admissions systems. Here is a hypothetical applicant, call him Daniel R., a strong, unhooked domestic student. He is not a real person, but a composite built to hold academic strength constant while we change only the system he applies through. What determines his odds is less his file than the machine reading it. SAT 1530 (~99th pct) GPA 3.95 UW Intended major: Engineering No legacy · no recruited sport · full-pay-adjacent United States Holistic review One reader scores the whole person: essays, personal rating, "institutional priorities." Academics are necessary, not sufficient. Est. admit odds, top-tier ~5% A near-perfect academic file only gets you to the baseline. Unhooked, male, and full-pay competes hardest against itself. United Kingdom Course-based selection Applies to one subject at Oxbridge. Judged on predicted A-levels, a subject admissions test (e.g. the ESAT/MAT), and a technical interview. Est. admit odds, at course level ~20% Demonstrated subject ability dominates. Personal "fit" and extracurricular breadth carry little weight. France Concours (exam) Two years of classes préparatoires, then a national competitive exam. A rank on a written test allocates the seat. Determinant of the seat Rank Almost purely exam-meritocratic at the point of entry. No essay, no personal rating, no legacy channel. Build a student · run the machine SAT 1530 Family income $175k Race field (the model varies only this) Hooks Estimated admit odds 36% Estimated net price / year $84k ILLUSTRATIVE MODEL — a simplified toy calibrated to the public figures on this page (Arcidiacono race deltas; net-price-by-income bands). Not a prediction for any real applicant or school. Every one of these systems carries its own biases upstream. The deeper point is that "merit" is defined by the machine that reads the file. Move Daniel across the border and the very traits that make him a residual in one system make him a front-runner in another. 07 · The punchline Same student. Fifty years apart. Stack the four forces together, the reserved seats, the holistic filter, the per-family price, and the demographic targets, and they compound. Hold the student constant at a top-decile academic profile and ask two questions across half a century: can he get in, and can his family pay for it? On both, the line moved the wrong way. The odds on a top-decile domestic applicant, then vs. now Two measures for the same academic percentile: chance of admission, and net price as a multiple of median household income. SOURCE · Admit rates from historical institutional reporting vs. current Common Data Sets; affordability indexed to Census median household income. A directional composite meant to show the trend, not exact endpoints. Fifty years ago a strong domestic student faced a selective but winnable gate, at a price a middle-class family could absorb. Today the same student faces a lottery, and if he wins it, a bill indexed to a wealth he doesn't have. The pipeline didn't close. It narrowed to a trickle, and got expensive. Methodology & sources A note on the numbers. Race / admit-probability model (25→36→77→95%) — P. Arcidiacono expert report, SFFA v. Harvard; NBER w27068. ALDC admit rates (athletes 86%, faculty 47%, dean's 42%, legacy 34%, non-ALDC <5.5%; 43% of white admits are ALDC) — Arcidiacono, Kinsler & Ransom, NBER w26316. Harvard admit rate & applications (3.59%, Class of 2028; 40k→61k apps) — Harvard Crimson. Demographics — 18–24 population, NCES tbl. 101.20; elite shares & international, Harvard CDS 2023–24. Net price & cost of attendance — NCES College Navigator (Princeton); Yale COA; FAFSA/SAI, U.S. Dept. of Education. Test-optional — FairTest; effect on high scorers, NBER Digest 2025. Enrollment by gender (men 42%, 2021) — NCES Fast Facts. UK / France systems — Oxford & Cambridge undergraduate admissions reports; French Ministère de l'Enseignement supérieur on classes préparatoires & concours. Editorial note: the counterfactual student Daniel R. is a composite constructed for illustration and does not depict any real individual.
SaaS & Software·Jul 14, 2026
What did SFFA vs. Harvard reveal about admissions?
Article URL: Comments URL: Points: 5 # Comments: 0
Hacker News9 min readSingle source
The gist
5-point summary · 1 minArticle URL: Comments URL: Points: 5 # Comments: 0
- Harvard: a baseline applicant with a 25% chance as Asian American would have ~36% as white, ~77% as Hispanic, ~95% as African American.
- 1 · Cost of attendance $97,985/yr Tuition Housing Fees The full sticker: tuition, housing, meals, fees, books, travel, personal.
- SOURCE · Harvard applications: 40,248 (Class of 2024, last test-required cycle) → 61,220 (Class of 2026, record-low 3.19% admit rate) — Harvard Crimson.
- Share of Common App colleges requiring scores fell ~55% (2019–20) → ~5% (2024–25); >1,900 colleges now test-optional — FairTest.
- Harvard admit rate & applications (3.59%, Class of 2028; 40k→61k apps) — Harvard Crimson.
$97,985$0$98k$110k$175k$84k
Integrity note · Xela does not rewrite or paraphrase article content. The excerpt above is the source publication's own words, sanitized for display. For the full piece — including any quotes, charts, or images — read it at Hacker News. Xela's rewritten version is off for this story, so there's no editorial angle attached — you're getting the source's reporting unfiltered. When the rewrite is on, we add a What this means block underneath with the operator/trader takeaway.
What people are saying
Discussion
Hot takes
0/280
Loading takes…
Comments
Discussion · 0
Sign in to comment, like, and save articles.
Sign inLoading comments…


![The Economics of Recursive Self-Improvement [pdf]](https://images.unsplash.com/photo-1486312338219-ce68d2c6f44d?w=1600&h=900&fit=crop&crop=entropy&auto=format&q=70)